
Assignment 1
Explorations of the Sine Wave
by Debra Jackson
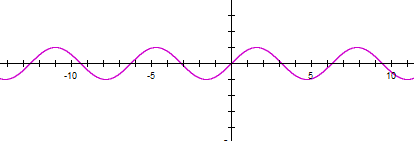
The graph of y = sin x on the coordinate plane looks like a wave and is called a sine wave or sinusoidal wave. If you look closely, you will see the the wave repeats itself and from the start to finish of the wave is called the period. Because this graph is related to the unit circle, the length along the x-axis of the period is 2 pi radians. Half the distance from the highest point to the lowest point of the wave is called the amplitude.
These previously described parts of the graph are shown as parameters in the formula for the sine graph, which is y = a sin (bx + c). a is the amplitude. b is the period. c is the phase shift. An example of y = sin x:
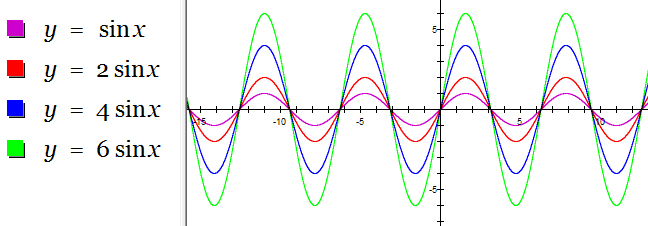
Below are examples of graphs with different values for a, b, and c. As a increases in value, the waves get higher and deeper.
When a is positive below: |
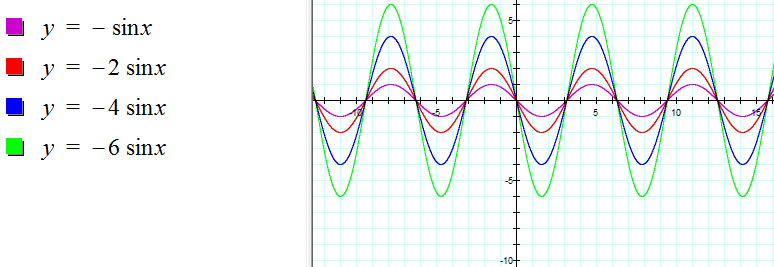
When a is negative below: |
 |
 |
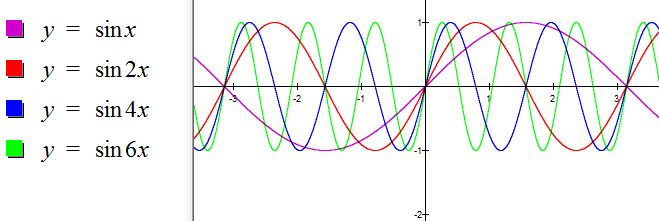
When b is positive below: |
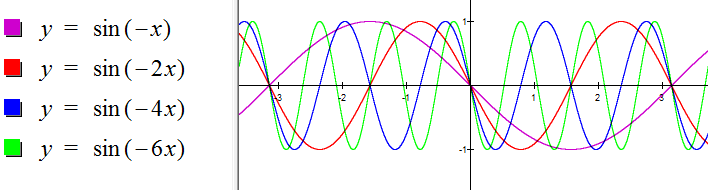
When b is negative below: |
 |
 |
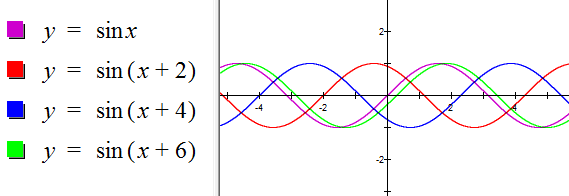
When c is positive below: |
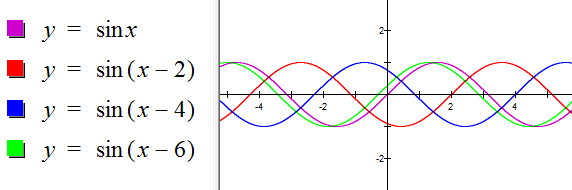
When c is negative below: |
 |
 |
As the amplitude a increases in value, the waves get higher and deeper. If the sign of a changes, then the graph is reflected across the x-axis.
As the period b increases in value, the number of cycles within the same period increases accordingly.
As the phase shift c is changed the entire graph is moved that much either left or right depending on whether c is positive or negative.
Here is what the sine wave looks like when the amplitude varies between -1 and +1.